Corporate responsibility
Environmental matters
We recognise that our activities may have both positive and negative impacts in Scotland and further afield. The Commissioner operates a hybrid working system with staff primarily working remotely. The level of in person events, such as conferences, seminars and witness interviews remain much reduced. As a result, the level of commuting to and from the office and to external events remains low, reducing car mileage and road use. The use of electronic communications has completed the transition to a near ‘paperless’ office. Our policies and procedures have always encouraged the use of public transport wherever practicable and reduced reliance on paper copies and postage.
Social, community and human rights issues
The Code of Practice for Ministerial Appointments to Public Bodies adopted in October 2022 includes a principle of “Equality, Diversity and Inclusion” which requires appointment practices to be inclusive for people from all walks of life and backgrounds. The Code also includes a principle of Respect and associated provisions. These require applicants to be accorded the respect that they are due for their interest and their efforts and appointees for their contribution to public life. The ESC strategic plan for 2024-28 includes an objective to refresh “Diversity Delivers”, a strategy intended to increase the diversity of Scotland’s boards such that they better reflect the communities that they serve. The strategic plan also includes a commitment to making the office more accessible to a wider range of people; the plan itself has been published as an Easy Read version.
Our activities are intended to ensure high levels of ethical standards on the part of elected members and those appointed to public office by Ministers. We also work to ensure fairness, transparency and equality of opportunity in the appointment process. Our strategic plan for 2024-2026 includes a set of values that reflect our approach to our interactions with the public and our stakeholder organisations. We have made a public commitment to treat each individual who comes into contact with us with kindness, empathy and respect. The conclusions that we reach on whether councillors, board members or MSPs have breached the rules that are applicable to their conduct are always reached having taken cognisance of the provisions of the European Convention on Human Rights.
Authorisation

Ian Bruce
Accountable Officer
Date: 03 October 2024
Corporate and financial performance
Performance against our business plan
The biennial business plan covering the period April 2023 to March 2025 set a range of corporate and financial goals. Progress is summarised below.
| Corporate Services Goals for 2023/24 | Achieved |
|---|---|
| Recruit to additional posts | ✔ |
| Successfully induct new staff | ✔ |
| Prepare biennial business plan and action plans for each function cascaded to individual action plans | ✔ |
| Ensure appropriate desk instructions for roles and functions are in place and up to date | ▲ |
| Complete annual performance reviews and identify any training or personal development needs | ✔ |
| Develop a fully costed, training programme covering individual, functional and organisational training requirements | ✔ |
| Formally survey staff on a range of topics | ✔ |
| Ensure all staff aware of our values as an office | ✔ |
| Review and revise all outstanding policies that are currently beyond their published review date | ✔ |
| Collate existing policies and procedures to create a single Governance Framework | ▲ |
| Review schemes of delegation | ▲ |
| Revise our Standing Orders | ✔ |
| Prepare a Medium-term Financial Plan or equivalent | ✔ |
| Develop, consult on and publish a strategic plan for 2024 to 2028 | ✔ |
| Review contractual arrangements and implement enhancements to the Case Management System | ▲ |
| Regularly review website to ensure content is up to date | ✔ |
| Investigate tendering for IT Managed Service Provider | ✔ |
| Investigate tendering for website developer and hosting services | ▲ |
| Investigate transfer to cloud-based server and records management and migrate main systems to M365 and Sharepoint | ✔ |
| Develop and implement project to ensure destruction of records in line with retention schedules by 2025 | ▲ |
| Consult on, develop and implement revised office accommodation format | ✔ |
✔ = Achieved, ▲ = Partially achieved, X = Not achieved | |
Further detail about the risks the organisation faced during the year is provided under the Key Risks and Issues heading of the Performance Overview section and in the Governance Statement.
Financial position
Background
The Commissioner is an independent office-holder and receives all of its funding directly from the Scottish Parliamentary Corporate Body (SPCB). The Commissioner operates against an annual cash-based budget that is reviewed by the SPCB and subsequently approved by the Scottish Parliament. The budget may also include access to contingency funding. The accounts are prepared on an accruals basis but the body is funded on a cash basis and management closely monitor financial performance on a cash basis.
Funding
The Scottish Parliamentary Corporate Body awarded a budget of £1,606,000 to the Commissioner for the financial year 2023/24 (2022/23: £1,143,000).
Following detailed assessment of our anticipated expenditure, the Commissioner surrendered £50,000 to the SPCB in February 2024.
Contingency funding was not required (2022/23: £85,000).
Total funding awarded for the year, including contingency funding was £1,556,000 (2022/23: £1,228,000). Of the funds awarded £1,554,000 was drawn down (2022/23: £971,000).
The Commissioner earned no income in 2023/24 (2022/23: Nil).
There was an £28,000 increase in cash during the year (2022/23: Decrease of £30,000). Cash held at the 31 March was £146,000 (2022/23 £118,000), reduced by current liabilities to £40,000 (2022/23: £32,000).
Expenditure
The accounts are prepared on an accruals basis meaning that expenses are recognised in the year in which they were incurred, rather than when the cash payment is made.
Including adjustments for accruals and prepayments, expenditure was £1,540,000 (2022/23: £1,014,000).
Expenditure against budget
| Expenditure | Actual £'000s | Budget £'000s | Variance £'000s % |
|---|---|---|---|
| Staff costs | 1,165 | 1,237 | (72) (6%) |
| Staff related costs | 14 | 21 | (7) (33%) |
| Property | 102 | 103 | (1) (1%) |
| Professional fees* | 158 | 165 | (7) (4%) |
| Running costs | 88 | 77 | 11 14% |
| Depreciation | 13 | - | 13 - |
| Revenue expenditure | 1,540 | 1,603 | (63) (4%) |
| Less depreciation | (13) | (13) - | |
| Capital expenditure | 5 | 3 | 2 67% |
| Cash expenditure | 1,532 | 1,606 | (74) (5%) |
| *Includes the cost of Public Appointments Advisers | |||
Revenue expenditure is prepared on an accruals basis but the body is funded on a cash basis. The table above allows a comparison between the two.
The cash budget was underspent by £74,000 (2022/23: £133,000 underspend). An analysis of spend in key areas is given below.
Staff costs were under budget by £72,000.
- The Commissioner submitted a bid for additional staff in May 2022, which was approved by the SPCB in October that year. When submitting the 2023/24 budget bid, we had anticipated having recruited to all of the additional posts by the beginning of April 2023. In the event, these staff members came on board throughout the 2023/24 year, reducing expenditure in this area. In addition, the Commissioner has decided not to make an appointment to one post as he considered that the work could be done by a contractor instead over a fixed term which will realise savings for the public purse in the medium to longer term.
Savings of £15,000 in other areas were used to offset £13,000 of expenditure on:
- Rolling replacement of IT equipment, enhancements to the Case Management System as well as updating the operating system and making accessibility improvements to the website.
Depreciation fell to £13,000 this year (2022/23: £18,000), applying to a full refresh of IT hardware in October 2019, chairs for the office and remote working purchased in March 2023 and the rolling replacement of IT equipment.
A further breakdown of expenditure is given in note 6 to the financial statements.
Payment of creditors
The Commissioner has committed to the CBI Prompt Payment Code for the payment of bills for goods and services received. Payments are normally made as specified in the agreed contract conditions. Where there is no contractual position or other understanding, they are treated as requiring to be paid within 30 days of receipt of the goods or services. Payment performance for 2023/24 was 99.4% (2022/23: 99.7%).
Public appointments
Improving diversity on the boards of public bodies
We have a statutory duty to use our powers with a view to ensuring that appointments are made fairly and openly and that as far as possible everyone has an opportunity to be considered. As part of our work in this area, the Commissioner agreed targets with the Scottish Ministers in the strategy document “Diversity Delivers” (published September 2008), intended to encourage applications from as wide a range of people as possible. The strategy also included a range of recommendations, agreed with the Scottish Government at the time, intended to improve on the diversity of Scotland’s boards. Progress against the recommendations is available on our website. The Commissioner has included a refresh and update of the diversity strategy in the Strategic Plan 2024-2028 and plans are underway to tender for a contractor to project manage this work.
The following tables and graphs show the extent to which Scotland’s board members at the end of 2023 reflect the population of the country as a whole and how it has changed over time.
Current demographic profile of Scotland's boards
| Target Group | Change in board membership profile | Profile of board members† at 31 December 2023 | Profile of board members† at 31 December 2022 | Scottish population (2022 Census) | Scottish population (2011 Census) |
|---|---|---|---|---|---|
| Female | -0.70% | 50.56% | 51.26% | 51.41% | 51.50% |
| Disabled | 1.15% | 10.95% | 9.80% | Not yet published | 19.60% |
| Black and minority ethnic†† | 0.14% | 5.04% | 4.90% | 7.13% | 4.00% |
| Aged 49 and under | -0.83% | 18.50% | 19.33% | 49.00% | 54.3%* |
| Lesbian, gay and bisexual | 0.01% | 5.33% | 5.32% | 4.04% | 6.0%** |
† All board members inclusive of the chair unless otherwise stated. Percentages do not include those who did not make a declaration.
†† Black and minority ethnic figures reflect people from a non-white minority ethnic background.
* Scottish Population aged 18 to 49 as a percentage of the whole population aged 18 and over.
** Estimated based on information from Stonewall Scotland website.
How the demographic profile of Scotland's boards is changing
As at 31 December
| At 31 March 2023 | At 31 March 2022 | At 31 March 2021 | At 31 March 2020 | At 31 March 2019 | At 31 March 2005 | Scottish Population* | |
|---|---|---|---|---|---|---|---|
| Female | 50.56% | 51.26% | 50.78% | 51.70% | 50.00% | 34.50% | 51.50% |
| Disabled | 10.95% | 9.80% | 8.56% | 7.40% | 7.20% | 2.40% | 19.60% |
| Black and minority ethnic (visible) | 5.04% | 4.90% | 3.71% | 3.60% | 2.80% | 2.80% | 4.00% |
* Scottish Population includes 2022 Census data for Female and ME and 2011 Census data for disability
| At 31 March 2023 | At 31 March 2022 | At 31 March 2021 | At 31 March 2020 | At 31 March 2019 | At 31 March 2018 | At 31 March 2005 | |
|---|---|---|---|---|---|---|---|
| Female | 50.56% | 51.26% | 50.78% | 51.70% | 50.00% | 48.60% | 34.50% |
| Scottish population female* | 51.41% | 51.50% | 51.50% | 51.50% | 51.50% | 51.50% | 51.50% |
| Disabled | 10.95% | 9.80% | 8.56% | 7.40% | 7.20% | 6.90% | 2.40% |
| Scottish population disabled* | 19.60% | 19.60% | 19.60% | 19.60% | 19.60% | 19.60% | 19.60% |
| Black and minority ethnic (visible) | 5.04% | 4.90% | 3.71% | 3.60% | 2.80% | 2.90% | 2.80% |
| Scottish population BME* | 7.13% | 4.00% | 4.00% | 4.00% | 4.00% | 4.00% | 4.00% |
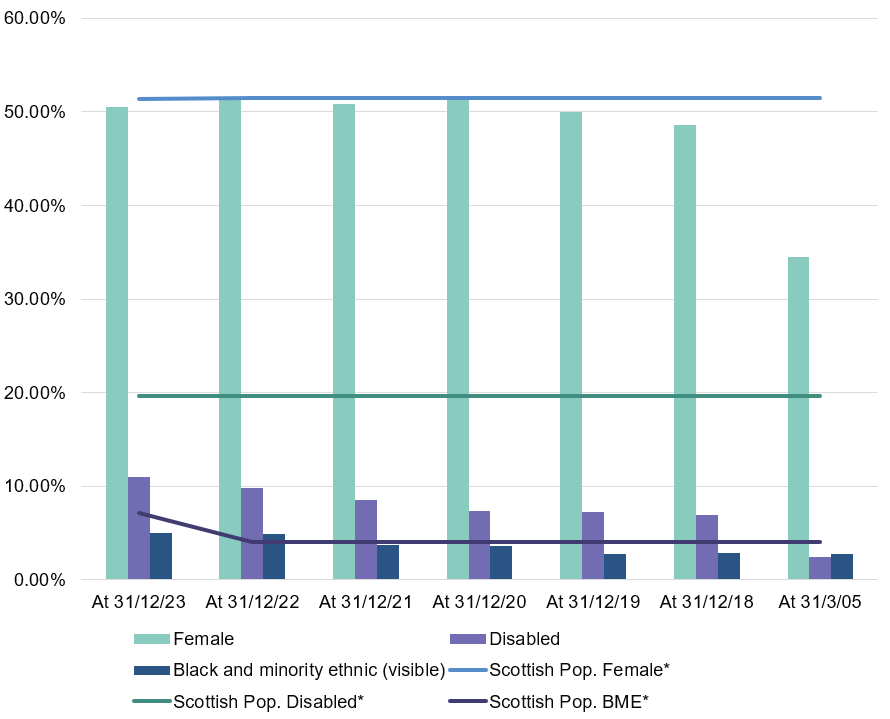
* Scottish Population includes 2022 Census data for Female and ME and 2011 Census data for disability
Socio Economic Information
In previous years there has been interest in understanding some wider aspects of diversity and how these are reflected (or not) on Scotland’s public body boards. Household income and sector worked (or most recently worked) in were originally recorded and reported in this report. In December 2021, Scottish Government officials introduced a new system for tracking applicants. This was introduced for all Scottish Government recruitment and included Public Appointments. Standard monitoring questions were introduced for all applicants using the system and these did not include the previously asked bespoke questions about household income or sector worked in. Instead, from February 2023, the Scottish Government introduced a socio-economic background question to the diversity monitoring form; the style of the question is based on evidence from the UK Social Mobility Commission which suggests that if you are to ask one socio-economic background-related question, then parental occupation is the most effective one for determining status.
As this information is still very new in being collected, figures for the overall demographics of those on boards (only including those appointed from February 2023 who were prepared to answer the question) were too low to report this year. The situation should improve year on year as successful candidates continue to be asked the question and we will seek to report on this as soon as the numbers are significant enough to provide meaningful information. We have been able to access information about applications and appointments related to this question and have provided the limited available information here instead. This information relates to appointment rounds conducted in 2023.
| Socio-economic category | 2023 | |
|---|---|---|
| Application % | Appointed % | |
| High Those whose parents were in "professional or managerial occupations" | 30.7 | 31.3 |
| Intermediate Those whose parents were in "clerical, sales, service and intermediate technical occupations | 5.4 | 5.3 |
| Routine Those whose parents were in "routine, semi-routine, low supervisory and technical occupations" | 12.1 | 14.7 |
| Never worked Those whose parents did not work | ^ | ^ |
| Prefer not to say | 2.4 | 0.7 |
| Not stated | 48.3 | 47.3 |
| All | 100 | 100 |
^ Values for fewer than five have been supressed to decrease the risk of disclosure of information about individuals.
Figure 8
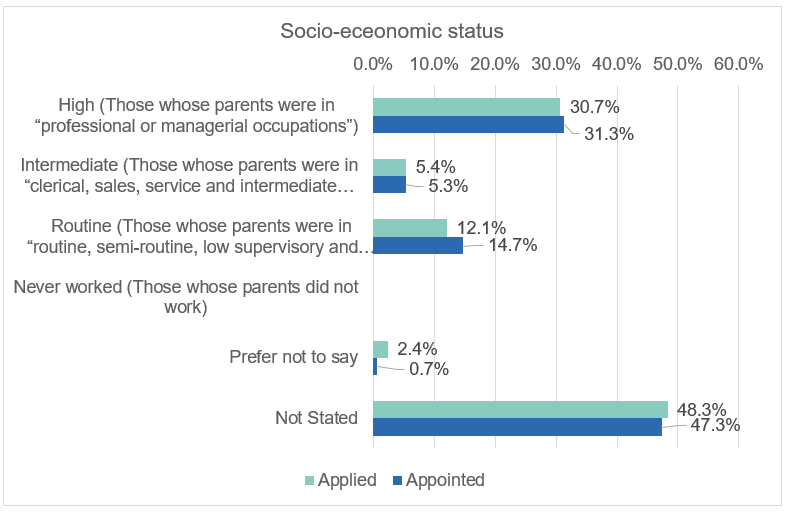
The question asked of applicants is “What was the occupation of your main household earner when you were about aged 14?” The high level of “not stated” responses has been attributed in part to the fact that the question did not begin to be asked until part way through the year.
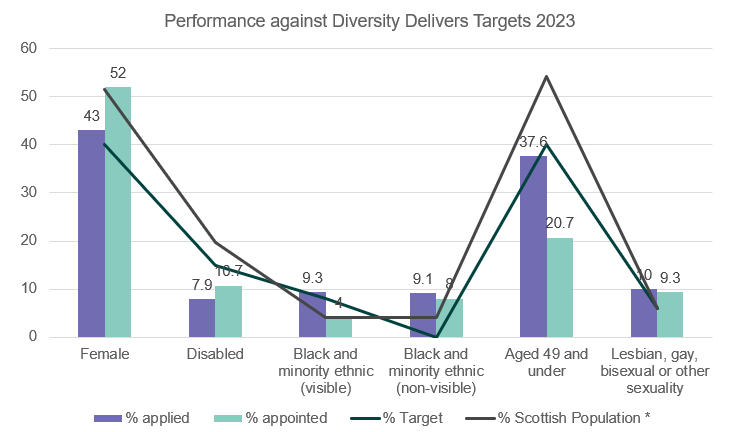
Performance against Diversity Delivers Targets 2023
The following chart shows the percentage of applications and appointments in 2023 by each target group as set out in Diversity Delivers. This information is provided by the Scottish Government and relates to a calendar year.
Performance against Diversity Delivers Targets 2023
| Target Group | % Target | % Applied | % Appointed | % Scottish Population |
|---|---|---|---|---|
| Female | 40 | 43 | 52 | 51.5 |
| Disabled | 15 | 7.9 | 10.7 | 19.6 |
| Black and minority ethnic (visible) | 8 | 9.3 | 4 | 4 |
| Black and minority ethnic (non-visible) | N/A | 9.1 | 8 | 4 |
| Aged 49 and under | 40 | 37.6 | 20.7 | 54.3 |
| Lesbian, gay, bisexual or other sexuality | 6 | 10 | 9.3 | 6 |
Applications and Appointments by Target Group
| Target Group | Target | 2023 | 2022 | 2021 | 2022 Scottish Population | 2011 Scottish Population | |||
|---|---|---|---|---|---|---|---|---|---|
| ➊ | ➊ | ➋ | ➊ | ➋ | ➊ | ➋ | Percentage | ||
| Female | 40% | 43% | 52% | 45.5% | 57.1% | 40.6% | 46% | 51.4% | 51.5% |
| Disabled | 15% | 7.9% | 10.7% | 10% | 5.7% | 13.8% | 14% | Not yet published | 19.6% |
| Black and minority ethnic (visible)** | 8% | 9.3% | 4% | 11.7% | 7.6% | 10.3% | 8% | 7.13% | 4% |
| Black and minority ethnic (non-visible) | N/A | 9.1% | 8% | 8.6% | 10.5% | 7.8% | 6.7% | 5.78% | 4.2% |
| Aged 49 and under | 40% | 40% | 20.7% | 47.7% | 37.1% | 30.7% | 27.3% | 49% | 54.3%*** |
| Lesbian, gay, bisexual or other sexuality | 6% | 10.0% | 9.3% | 7.8% | 6.7% | 6.8% | 6% | 4.04% | 6.0%**** |
| Has a Trans status or history | N/A | ^ | ^ | ^ | 0.0 | 0 | 0 | 0.44% | N/A |
Key:
Applications (including incomplete) ➊, Appointed ➋
^ Values for fewer than five have been supressed to decrease the risk of disclosure of information about individuals.
* Unless otherwise stated, all population figures are extracted from 2011 census data
** The target for the BME population is inclusive of people from non-visible minority groups. Up until 2017 the figures reported on have related to visible minority applicants and appointees. From 2017 onwards, the figures have been provided for both visible and non-visible. For this latter category the monitoring form question responded to is “Other white” and includes those who selected “Irish”, “Polish” or “Other white ethnic group”.
*** Scottish population aged 18 to 49 as a percentage of whole population 18 and over
**** Estimated based on information from Stonewall Scotland website
Performance against our business plan
The Commissioner’s biennial business plan for 2023-2025 included actions intended to contribute to the achievement of our strategic objective relating to public appointments. Progress against the business plan is summarised in the following table:
| Public Appointments | Milestones | Achieved | |
|---|---|---|---|
| A1 | We will assist with the implementation of the revised Code of Practice for appointments with a greater focus on outcomes, accountability and transparency and an emphasis on learning lessons. | i. Have parts of Code that are of interest and relevance to the public translated into British Sign Language (BSL), Easy Read and other languages. | i ✔ (Some content has been translated into BSL and to Easy Read. We intend to consider new topics for translation on an annual basis from now on.) |
| A2 | We will provide guidance and support to everyone engaged in the appointments process with a view to their implementing the new Code's provisions effectively. | i. Draft and publish statutory guidance ii. Run training and review training developed by Scottish Government (SG) for all relevant stakeholders on new Code's application iii. New Code comes into effect iv. Continual training and guidance developed to support revised Code | i ✔(Published October 2022) ii ✔ (SG training reviewed July - October 2022. Joint training for Public Appointment Advisers (PAAs) and SG officials in August 2022) iii ✔ (Published 31 March 2022 and came into effect from October 2022) iv ✔ (guidance provided as required since Code came into effect from October 2022) |
| A3 | We will report publicly on the difference that the new Code of Practice is making to the appointments process, for good or bad, with a view to improving on practices. We will do so by publicising instances of good practice or innovative practice and learning as well as areas for improvement. | i Engage with the Scottish Parliament's subject committee about appointments practices with a view to making improvements and increasing transparency ii Agree suitable reporting arrangements iii. Following discussion, submit periodic reports iv. Publish good practice case studies on website. v. Continue to feed into lessons learned for the Scottish Government by seeking applicant and panel member views: • Run applicant surveys on a round by round basis and provide a feedback report, whenever a request to run a survey is made. • Survey panel chairs (and body chairs where appropriate) at the end of appointment rounds to seek their views on PAA performance and the Public Appointments process. | i ✔ ii X (No suitable reporting arrangements were agreed) iii X (End of round information has been analysed and is available if there is interest, but formal reporting arrangements were not agreed) iv ▲ (Good practice case studies are being planned and prepared – some snippets of good practice have been published.) v. ✔ (Applicant surveys have been run for all 2022 Code rounds completed) v. ✔ (The review process has re-commenced for all 2022 Code rounds) |
| A4 | We will seek support to revise and republish Diversity Delivers, to include new recommendations for the achievement of greater board diversity. | i. Consult informally from October 2023 ii Run formal consultation from June 2024 iii. Commence research into good practice and what the content of the revised strategy should include | i X (This has been delayed but work is underway to tender for a contractor to project manage the work) ii X (This has been delayed but work is underway to tender for a contractor to project manage the work) iii. ▲ (some basic initial research has commenced) |
| ✔ = Achieved, ▲ = Partially achieved, X = Not achieved | |||
We publicly report progress against our Biennial Business Plan which can be found on the website. The most recent version is here: Biennial Business Plan 2023-2025 - Progress as at 31 March 2024.
Monitoring and reporting
All information under this heading relates to the Commissioner’s statutory duties to monitor and report on appointment activity and to provide guidance on application of the Code.
The Commissioner’s remit extended to 770 posts on the boards of 100 public bodies at the year end. In the case of a proportion of these bodies, such as regional colleges, only the chair appointments are regulated. Additionally, some bodies are statutorily included in the Commissioner’s remit even though they are either abolished or no longer active.
How many bodies and positions do we regulate?
| At 31 March | 2024 | 2023 | 2022 |
|---|---|---|---|
| No. of bodies regulated | 100 | 100 | 99 |
| No. of posts regulated | 770 | 748 | 733 |
| Avg. no. of regulated positions per board | 7.7 | 7.5 | 7.4 |
A list of the regulated bodies is available at https://www.ethicalstandards.org.uk/regulated-bodies.
How many appointments did we oversee?
Appointments are made through a process called an appointment round. During the financial year 2023/24, we were active in overseeing 86 appointment rounds.
Multiple appointments can be made through a single appointment round and the Scottish Ministers can run more than one round in a single year per public body. In certain circumstances we allocate a Public Appointments Adviser (PAA) to oversee all or part of the round. We report on these allocations rather than the number of appointment rounds as this better reflects our actual workload - not every allocation becomes an appointment round.
Number of allocations made
| Allocations made | 2023/24 | 2022/23 | 2021/22 |
|---|---|---|---|
| Brought forward from previous year | 24 | 54 | 52 |
| Started in year | 62 | 42 | 81 |
| Active during year | 86 | 96 | 133 |
| Completed | 62 | 72 | 79 |
| Open at end of year | 24 | 24 | 54 |
Presented by financial year rather than calendar year, as information obtained from ESC records rather than those of the Scottish Government.
| Number of | 2023 | 2022 | 2021 |
|---|---|---|---|
| Reappointments | 97 | 129 | 111 |
| Extensions | 12 | 22 | 18 |
Satisfaction with PAA contribution and the extent to which panel chairs feel able to shape the appointments process and body chairs feel able to contribute to discussions around succession planning and influence what was sought
Under the 2022 Code the panel chair takes on specific responsibilities and represents the appointing minister. When seeking views on PAA performance we previously asked for feedback on the appointments process at the same time. As the panel chair is now responsible for the process, it was no longer appropriate to ask this question and we therefore now seek views about the extent to which they felt able to shape the process in their role as panel chair (1=not at all, 5=greatly). We also ask body chairs how able they felt to contribute to discussions on succession planning and to influence what was sought.
| Average satisfaction level | 2023/24 | 2022/23 | 2021/22 |
|---|---|---|---|
| PAA's contribution | 4.55 | 4.51 | 4.67 |
| Appointments process | N/A | 3.91 | 4.15 |
| The extent to which panel chairs feel able to shape the process | 4.20 | ||
| The extent to which body chair feel able to influence discussions on succession planning | 4.70 | ||
| |||
Any comments or constructive suggestions made are acted upon by the Commissioner as appropriate.
Providing guidance
Enquiries and reports arising from scrutiny
The following tables summarise substantive contacts with the ESC office during the reporting year. As this information is gathered by ESC, it is reported by financial year.
| Issues raised | 2023/24 (2013 Code) | 2023/24 (2022 Code) | 2022/23 (2013 Code) | 2022/23 (2022 Code) | 2021/22 |
|---|---|---|---|---|---|
| Enquiry - Asked for advice on the Code of Practice | 2 | 135 | 81 | 72 | 150 |
| Enquiry - Asked for advice on good practice | - | 20 | 15 | 19 | 32 |
| Enquiry – Asked for exceptions to the Code, or term extensions or to discuss options not covered by the Code | 3 | 53 | 20 | 10 | 39 |
| Diversity research enquiry | - | - | - | - | - |
| Enquiry - General enquiry on the work of the office | - | 19 | 7 | 6 | 10 |
| Enquiries and Reports - Miscellaneous or “Other” enquiries or reports | 4 | 116 | 85 | 73 | 206 |
| Enquiry - Freedom of information requests | - | - | - | - | - |
| PAA End of Involvement report [1] | 1 | 61 | - | - | - |
| Panel chair end of round report [2] | - | 53 | - | - | - |
| Report a complaint about an appointment round | 1 | 2 | - | - | - |
| Report a concern about an appointment round or a failure in administration | 1 | 53 | 40 | 24 | 71 |
| Report about good practice | - | 35 | 24 | 41 | 49 |
| Report an update on round activity | 4 | 92 | 65 | 45 | 41 |
| Report about non-compliance with the Code of Practice | 1 | 17 | 10 | 3 | 4 |
| Total | 673 | 640 | 602 | ||
[1] PAAs have always been provided reports at the conclusion of an appointment round, but the figures to date have not been provided
[2] Panel chair end of round reports are new to the 2022 Code of Practice. Only 2 were provided in the 2022/23 year (due to the Code only recently being in place) and so had not been recorded formally in the 2022/23 annual report. They will be recorded from this point forward.
Guidance on application of the code
The Commissioner’s office provides Code interpretation guidance, primarily to officials and PAAs, on a very frequent, ad hoc basis. Where trends are identified, the Commissioner seeks to provide general guidance with a view to improving on practices and increasing understanding.
A number of pieces of guidance required to be issued during 2023/24:
The Statutory guidance was updated as a result of a finding of a material breach of the Code. This breach occurred as a result of the minister making a decision that there was an issue (in this case being a locally elected councillor) which precluded an individual from being appointed to the public body board. As this disqualification had not been made clear in the applicant information pack, a councillor applied in good faith and would otherwise have been appointed, had it not been that the minister decided to apply the disqualification during the final stage of selection. The statutory guidance has been updated to provide advice on such a situation and confirm that disqualifications should be considered and (where relevant) included in the applicant information pack, so that applicants can be clear about whether they want to apply or not.
Further recommendations were made as a result of two stage 3 complaints received and investigated by the office during the year. One of these investigations involved recommendations being made relating to good succession planning and reappointments. The other involved an investigation into 15 different appointment rounds where the complainant was concerned that an unwritten policy to progress applicants who shared protected characteristics as outlined in positive action statements in applicant information packs before other applicants (including them). This allegation was made based on the complainer reading the press releases issued at the end of appointment rounds. The complainer could not understand why the people appointed were more meritorious than they were. Although the investigation found that there was no such unwritten policy, it also concluded that the news releases could have provided a more accurate description of how the successful candidate had met the criteria for the role. We recommended that future news releases should more accurately reflect the requirements for the role set out in the application pack. The Scottish Government agreed to implement this recommendation.
Two overarching Code variation requests were made and granted – one to allow panels to make use of a guaranteed interview scheme and the other to request that panel membership (other than panel chair and body chair) could be changed before the planning meeting without reference to the Commissioner.
Complaints about lobbyists
The Commissioner can investigate complaints about a lobbyist who has not:
- registered with the Scottish Parliament
- provided accurate and complete information in their registration
- submitted a return detailing any lobbying undertaken
- supplied an accurate and complete response to a request by the Scottish Parliament for information about their lobbying.
Were there any complaints about lobbying?
During the year we received one complaint regarding a failure to register lobbying activity appropriately (2022/23: One, 2021/22: Nil). The complaint did not pass the statutory tests for admissibility and was therefore closed without proceeding to investigation and reporting.
Our performance
Local authority councillors and board members of a public body
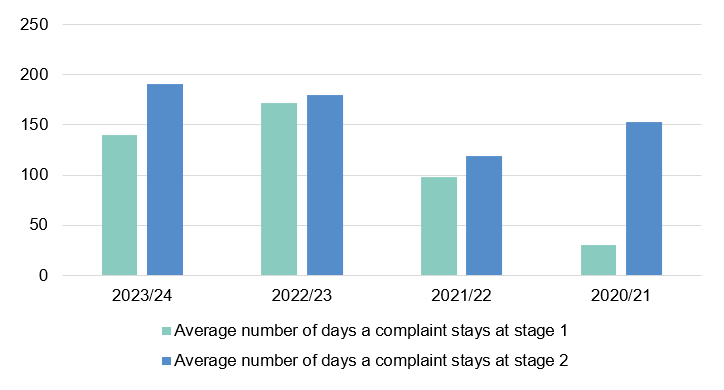
We currently collect high level information relating to the average number of days taken for both initial assessment (Stage 1) and investigation (Stage 2). In 2023/24, the average number of days taken for initial assessment was 140, while for investigation it was 191. Exhibit 15 sets out the information for 2023/24 and the three previous years.
The average number of days taken at stage 1 has reduced from an average of 172 days in 2022/23 to 140 days in 2023/24. This is a 20% reduction in the average time taken compared to the previous year. This improved performance is due to the expanded range of triage interventions we have put in place and the part year effect of new colleagues joining the team. We aim to reduce this timescale further in 2024/25.
The average number of days taken at stage 2 is similar to last year, slightly up by 6%, with Respondent response times, time taken by Respondents to engage legal representation and eligible requests for extensions to reply to correspondence all adding to overall average times. Although these timescales have marginally increased this has happened within the context of increased workload for the entire team, with 29% more active cases in the year and a 12% increase in the number of cases completed compared to the previous financial year.
We also plan to collect and publish more detailed information on the extent to which we are meeting our target times for our initial assessment of complaints and for investigations. This information will be available on our website.
Work to reduce investigation times is ongoing and changes introduced to allow us to work more efficiently are now having an impact on the time taken to investigate. The situation is continually improving and the expansion of our team over the year will continue to reinforce this direction of travel, placing us in a more favourable position as we enter future years.
| 2023/24 | 2022/23 | 2021/22 | 2020/21 | |
|---|---|---|---|---|
| Average number of days a complaint stays at stage 1 | 140 | 172 | 98 | 30 |
| Average number of days a complaint stays at stage 2 | 191 | 180 | 119 | 153 |
MSPs
There are two high level performance targets in place for MSP complaints as follows:
At Stage 1, the Commissioner is required to report to the Standards, Procedures and Public Appointments Committee, the Complainer and MSP who is the subject of the complaint, if the stage exceeds two months. Of the 37 cases that were assessed for admissibility in 2023/24, 4 cases took over two months.
At Stage 2, this same reporting arrangement as Stage 1 is required if this stage exceeds six months. No complaints proceeded to stage 2 in 2023/24.
As with Councillor and Member complaints, we will also collect and publish more detailed information on the extent to which we are meeting our target times for our initial assessment of complaints and for investigations. This information will be available on our website.
Forward looking assessment
During 2023/24, we received assurance from our internal auditors that the controls we have in place for our investigatory procedures are substantial and that we have fully implemented all the recommendations from 2022/23 relating to our investigatory processes.
Our future plans are all contained within our 4-year Strategic Plan that is underpinned by a detailed Action Plan for the Standards Team. This plan will help drive forward improvement over the next four years. It sets out a blueprint for a comprehensive Quality Assurance Framework to provide assurance around quality of outputs and drive forward service standards. Other elements of the Action Plan cover the new Target Operating Model and a commitment to re-establish a UK wide Ethical Standards Network.
We will maintain a focus on training and development across the team, ensuring staff are not only equipped to fulfil the requirements of the role, but also have expert knowledge across important functions in local government (such as planning and licensing) and in areas where we receive the largest number of complaints.
For those that come into contact with us, in whatever form, we want to improve the customer service experience through gathering feedback and acting on it or being able to signpost individuals quickly and efficiently to a more appropriate body, in cases where we cannot help them. During 2023/24 we rolled out a complaint survey to gather feedback on the customer service received by both complainers and responders. Due to the small sample size gathered this year, with only three surveys completed, we are unable to publish the results. We will seek to improve return rates during 2024/25 in order to provide this information in our next and subsequent annual reports. We will, in any case, continue to engage with our stakeholders, seeking opportunities to listen to their views and using this to inform our approach.
Performance against our business plan
The biennial business plan covering the period April 2023 to March 2025 included a range of actions to be completed by the investigations team. Progress is summarised below.
| Investigations Team Actions for 2023/24 | Achieved |
|---|---|
| Reintroduce previous KPIs and consult on these and other new ones to track progress of investigatory work | ✔ |
| Put tracking measures in place and assess for efficacy/accuracy. | ✔ |
| Report on progress internally against KPIs quarterly | ✔ |
| Report on progress against KPIs externally annually | ▲ |
| Stay up to date with case and legislative developments in ethical standards framework across UK (then integrate as standing agenda item in IO meetings) | ▲ |
| We will publish our procedures as revised so that everyone knows what to expect | ✔ |
| Maintain an up to date investigations manual | ✔ |
| Review and update the investigations manual on a regular basis to ensure it is fit for purpose and reflects our procedures | ✔ |
| Publish web page version of the Investigations Manual | X |
| Rolling project to have information on our complaint handling work that's of interest and relevance to the public translated into BSL, Easy Read, video and other languages | ▲ |
| We will highlight the need for the provision of support for complainers, respondents and witnesses in cases in which we are investigating complaints about bullying and harassment, including sexual harassment | ✔ |
| We will highlight sources of support available to stakeholders | ✔ |
| Identify sources of support in a centralised internal database | ✔ |
| Signpost support on templates | ✔ |
| Signpost support on ESC website | ✔ |
| Include a survey that both complainers and respondents can complete on an anonymous basis to give views on how we investigate complaints | ✔ |
| Design and roll out survey, updating relevant templates and contacting complainers and respondents from complaints closed from March 2023 onward | ✔ |
| Set baseline based on initial results | X |
| Analyse, consider and plan how to integrate relevant feedback from survey | X |
| Develop a communications strategy | ✔ |
| Implement actions arising from the Communications Strategy | ▲ |
| Review contractual and practical arrangements for Case Management System (CMS) | ✔ |
| Further assess proposed amendments to existing CMS | ✔ |
| Review scheme of delegation to incorporate results of workforce planning | ✔ |
| Induct all new staff into their roles | ✔ |
| Induction new staff successfully completed | ✔ |
| Prepare action plans for all activity for next two years based on biennial business plan – map staff/resources/available skillsets to all activities. Staff members and teams mapped to individual actions – ensure resilience/double cover as failsafe for staff departures and/or incapacity. | ✔ |
✔ = Achieved, ▲ = Partially achieved, X = Not achieved | |
Complaints about MSPs
We investigate complaints about the conduct of MSPs. We adopt a similar approach to Councillor and Member complaints in that, when we receive several complaints about the same or closely related issues, we combine these complaints together and assess and/or investigate them in what we describe as a single case. This consolidated approach ensures that similar complaints are addressed in a uniform manner, promoting fairness and consistency in the outcome. Reporting on both the number of complaints and cases also helps better reflect the actual volume of work in a given year.
Upon receipt of a complaint about an MSP, the Commissioner assesses the admissibility of that complaint: this is known as Stage 1. Where a complaint is admissible (i.e. accepted), it moves to Stage 2 which we term further investigation.
Exhibits 10 and 11 set out the volumes of both complaints and cases that the Standards Team handled during 2023/24.
| Complaints | 2023/24 | 2022/23 | 2021/22 |
|---|---|---|---|
| Already open at 1 April (beginning of financial year) | 5 | 526 | 739 |
| Received | 93 | 46 | 118 |
| Active during year | 98 | 572 | 857 |
| Completed | 71 | 567 | 97 |
| Complaints remaining open at 31 March | 27 | 5 | 760 |
NOTE: Towards the end of the 2020/21 financial year the Commissioner received a significant number of complaints relating to a similar issue. The majority of these complaints were grouped together into what we described as a “super complaint”. Following assessment of the “super complaint” during the 2022/23 financial year, we removed 234 complaints where complainers had failed to name the specific MSPs who they wished to complain about, despite being asked to clarify this in correspondence. As these details weren’t provided, we required to reduce the number of complaints recorded for the sake of transparency for reporting purposes. These complaints were all concluded during 2022/23.
| Cases | 2023/24 | 2022/23 | 2021/22 |
|---|---|---|---|
| Already open at 1 April (beginning of financial year) | |||
| Stage 1 | 3 | 19 | 14 |
| Stage 2 | 1 | ||
| Received | 43 | 31 | 54 |
| Active during year | 46 | 50 | 69 |
| Completed | 37 | 47 | 50 |
| Cases remaining open at 31 March (end of financial year) | |||
| Stage 1 | 9 | 3 | 19 |
| Stage 2 |
We deal with a wide range of differing complaints about the behaviour of MSPs, as set out in Exhibit 12. The category relating to other, covers all types of other complaints we received in the office covering for example the use of inappropriate language at events and the work of parliamentary committees. We have seen a decline this year in the number of complaints about conduct on Social Media.
| Categorisation of Complaint | 2023/24 | 2022/23 | 2021/22 |
|---|---|---|---|
| Breach of confidentiality | 1 | 11 | |
| Register/declaration of interest | 2 | 1 | 3 |
| Treatment of other MSP's/staff | 1 | 1 | 6 |
| Other | 89 | 44 | 98 |
| Total | 93 | 46 | 118 |
As detailed in Exhibit 12, we received a total of 89 complaints categorised as “other” which were consolidated into 39 cases. Exhibit 12b provided a more detailed breakdown of those cases which have been categorised as ‘other’. These can often cover more than one topic but they have been grouped into their key themes.
Exhibit 12b - Breakdown of 'other' cases received in 2023/24 into key themes
When the Commissioner receives a complaint about the conduct of an MSP, we assess whether the complaint is ‘admissible’ pursuant to three statutory tests. If it does, we can accept the complaint for investigation. Exhibit 13 provides this information in more detail.
| Reason for inadmissibility | 2023/24 | 2022/23 | 2021/22 |
|---|---|---|---|
| Dismissed under the first statutory test – the complaint was not “relevant” – for example, it did not concern the conduct of an MSP | 70 | 76 | 93 |
| Dismissed under the third statutory test – was the complaint of enough substance to justify further investigation – that is, was there sufficient evidence? | 1 | 489 | |
| Inadmissible | 71 | 565 | 93 |
| Admissible | 2 | 2 | |
| Totals | 71 | 567 | 95 |
Where a complaint is ‘admissible’ we investigate and report our findings to the Standards, Procedures and Public Appointments Committee of the Scottish Parliament. There were no such reports in 2023/24.
Complaints about local authority councillors and board members of public bodies
Complaint volumes in 2023/24
Exhibits 1 & 2 set out the volumes of both complaints and cases that the Standards Team handled during 2023/24. When we receive several complaints about the same or closely related issues, we combine these complaints together and assess and/or investigate them in what we describe as a single case. This consolidated approach ensures that similar complaints are addressed in a uniform manner, promoting fairness and consistency in the outcome. Reporting on both the number of complaints and cases also helps better reflect the actual volume of work in a given year.
During the 2023/24 financial year, the number of complaints received more than doubled compared to the previous financial year (Exhibit 1). The Standards Team successfully completed a total of 141 cases, representing a 12% increase from the previous year (Exhibit 2). The higher completion rate was achieved despite a 29% rise in the number of active cases under consideration in 2023/24 compared to 2022/23 (Exhibit 2). The planned expansion of the Standards Team in early 2023/24 has provided the necessary capacity to begin to manage this increased demand.
| Complaints | 2023/24 | 2022/23 | 2021/22 |
|---|---|---|---|
| Already open at 1 April (beginning of financial year)1 | 96 | 150 | 24 |
| Received | 344 | 156 | 330 |
| Councillor | 317 | 127 | 272 |
| Board Member | 27 | 29 | 58 |
| Active during year | 440 | 306 | 354 |
| Completed | 209 | 218 | 208 |
| Cases remaining open at 31 March (end of financial year) | 231 | 88 | 146 |
| 1There are minor differences in the carry forward totals from 2021/22 to 2022/23 and from 2022/23 to 2023/24. This is due to a small number of cases either being re-opened or additional complaints being added to existing cases. | |||
| Cases | 2023/24 | 2022/23 | 2021/22 |
|---|---|---|---|
| Already open at 1 April (beginning of financial year)1 | 67 | 86 | 8 |
| Received | 184 | 109 | 164 |
| Councillor | 172 | 94 | 143 |
| Board Member | 12 | 15 | 21 |
| Active during year | 251 | 195 | 172 |
| Completed | 141 | 127 | 88 |
| Cases remaining open at 31 March (end of financial year) | 110 | 68 | 84 |
| 1There are minor differences in the carry forward totals from 2021/22 to 2022/23 and from 2022/23 to 2023/24. This is due to a small number of cases either being re-opened or additional complaints being added to existing cases. | |||
Types of complaints received
Exhibit 3 details the types of complaints received during 2023/24, highlighting that disrespect towards employees and the public remained the most common complaint category, consistent with the previous years. Overall complaints related to disrespect towards employees, the public and councillors/members accounted for 55% of the total.
| Type of complaint | 2023/24 |
|---|---|
| Disrespect towards employees/public | 157 |
| Outwith jurisdiction | 47 |
| Disrespect towards other councillors/members | 33 |
| Quasi-judicial or regulatory applications | 30 |
| Other | 28 |
| Breach of confidentiality | 20 |
| Failure to declare an interest | 13 |
| Financial misconduct/Misuse of council facilities | 10 |
| Failure to register an interest | 5 |
| Breach of key principles | 1 |
NOTE: Outwith jurisdiction complaints are complaints which are about conduct which, following assessment, does not fall within the remit of the Code. They are distinct from complaints which we cannot accept as they are outwith the jurisdiction of the Commissioner’s office, such as a complaint about a Councillor in England.
As detailed in Exhibit 3, we received a total of 190 complaints related to disrespect, which were consolidated into 76 cases. Exhibit 3b offers a deeper analysis of these cases, breaking down the instances of disrespect directed towards employees, the public and councillors/ members. While some complaints encompass multiple issues, they have been categorised by their key themes.
Exhibit 3b – Analysis of disrespect cases received in 2023/24 by key themes
Submissions of complaints
Exhibit 4 details the sources of complaints received in 2023/24. Complaints from members of the public comprised 80% of the total, which is consistent with previous years. Complaints from councillors and members made up 17% of the total, increasing their 10% share from 2022/23.
Exhibit 4 – Individuals who submitted complaints during 2023/24
Outcomes from complaints lodged with us
The Standards Commission for Scotland (SCS) had previously issued three Directions to us pursuant to sections 10 and 11 of the 2000 Act. The Directions related variously to eligibility criteria for when a complaint requires to be accepted for investigation, issuing three-monthly updates to parties during investigations and reporting on all investigation outcomes to the SCS. Of these, the Direction on eligibility expired in August 2023 and was not renewed, on the basis that the eligibility criteria have become a permanent part of the Investigations Manual. The Direction on issuing three-monthly updates has been rescinded with effect from 30 May 2024 as, amongst other things, the SCS Members noted the office already had processes in place about updating parties and these were also written onto the face of the Manual. As a result, the remaining Direction on reporting remains in place, with a current expiry date of 31 January 2025.
Exhibits 5 and 6 set out the outcomes of the complaints and cases we received in 2023/24. Of the 209 complaints completed in 2023/24, 127 were assessed as ineligible and closed following initial assessment. This resulted in 76 complaints (amounting to 52 cases) proceeding to investigation and 6 complaints (amounting to 5 cases) being withdrawn. Of the 76 complaints investigated, we found a breach of the relevant code in 20 complaints (14 cases) and no breach in 56 complaints (38 cases). We report to the SCS on the outcomes of all cases investigated.
| Outcomes | 2023/24 | 2022/23 | 2021/22 | |||
|---|---|---|---|---|---|---|
| Initial assessment | 127 | 61% | 121 | 56% | 125 | 60% |
| Full investigation | 76 | 36% | 79 | 36% | 75 | 36% |
| Breach | 20 | 10% | 17 | 8% | 6 | 3% |
| No breach | 56 | 27% | 62 | 28% | 69 | 33% |
| Withdrawn | 6 | 3% | 18 | 8% | 8 | 4% |
| Total completed | 209 | 218 | 208 | |||
| Outcomes | 2023/24 | 2022/23 | 2021/22 | |||
|---|---|---|---|---|---|---|
| Initial assessment | 84 | 59% | 69 | 54% | 56 | 64% |
| Full investigation | 52 | 37% | 45 | 36% | 26 | 29% |
| Breach | 14 | 10% | 9 | 7% | 5 | 6% |
| No breach | 38 | 27% | 36 | 28% | 21 | 23% |
| Withdrawn | 5 | 4% | 13 | 10% | 6 | 7% |
| Total completed | 141 | 127 | 88 | |||
Case Outcomes
As set out in Exhibit 6, in 2023/24 we completed 141 cases and in 14 cases a breach of the relevant code was found. Exhibit 7 provides details of the outcome in the remaining 127 cases completed during the 2023/24. In total, 70% of these cases were closed at assessment stage, with the most common reason for this being due to ‘no evidence or insufficient evidence being available to support the allegation’, which is a term used by the internal case management system to show cases that, when assessed, do not match the eligibility criteria for acceptance to investigation.
| Categorisation of Complaint | No Breach | Not Pursued Further | Totals |
|---|---|---|---|
| Introduction/Key Principles | 1 | 1 | |
| Outwith 12 months | 7 | 7 | |
| Personal conduct/not acting as a Councillor | 3 | 3 | |
| Insufficient/no evidence to support allegation | 37 | 70 | 107 |
| Not about a Councillor or Member | 1 | 1 | |
| Withdrawn | 5 | 5 | |
| Other | 1 | 2 | 3 |
| 2023/24 Total | 38 | 89 | 127 |
Interim Reports
The Commissioner has the power to issue an interim report to the SCS requesting that a Councillor or board member be suspended prior to the completion of an investigation. This may be required where the further conduct of an investigation is likely to be prejudiced if a suspension is not imposed or it is in the public interest to impose a suspension. The SCS can direct the Commissioner to submit such an interim report. On receiving the interim report, the SCS may suspend the Councillor or board member.
This step is reserved for the most serious complaints received, where the conduct complained of poses a risk of harm to others, including members of the public, other councillors or council staff, or has the potential to significantly undermine the ethical standards framework. The Commissioner did not issue any interim reports in 2023/24.
Reports referred to SCS
In 2023/24, a total of 52 cases were referred to SCS. The Commissioner found a breach in 14 cases, and a further 38 reports were referred where no breach was found (Exhibit 6). The outcome from these reports following referrals to SCS is set out in Exhibit 8 below. Where SCS directs further investigation, the Commissioner undertakes the further investigation requested and then refers the report back to SCS. SCS then decide whether to take no further action or to hold a Hearing.
The Commissioner may combine similar cases into one report or the SCS may combine similar reports into one hearing. Exhibit 8 shows the number of cases where a report was referred to the SCS but due to these reasons, the figures may differ from the actual number of hearings held by the SCS, which is laid out in Exhibit 9 below.
| Action taken by SCS | Breach report referred to SCS | No breach report referred to SCS |
|---|---|---|
| No further action taken by SCS | 4 | 29 |
| Hearing held by SCS | 10 | 9 |
| Hearing held where SCS directed further investigation | 1 | |
| Hearing held where SCS did not direct further investigation | 8 | |
| Total number of reports referred in each category | 14 | 38 |
Hearings
| Case number | Council/ Public Body | Nature of Complaint | ESC Decision | Hearing Date | Hearing Decision | Sanction imposed |
|---|---|---|---|---|---|---|
Reports referred in 2022/23 and hearing held in 2023/24 | ||||||
| LA/An/3690 | Angus | Disrespect towards other Councillors | Breach | 01/05/2023 | No breach | Not found in breach |
| LA/H/3755 | Highland | Quasi- Judicial or Regulatory Applications | No breach | 23/05/2023 | No breach | Not found in breach |
| LA/D/37451 | Dundee City | Disrespect towards employees/public | Breach | 06/06/2023 | Breach | Censure |
| LA/S/3571 | Stirling Council | Disrespect towards employees/public | Breach | 21/06/2023 | Breach | Suspension |
| LA/SL/3558(a) | South Lanarkshire | Confidentiality | Breach | 27/06/2023 | Breach | Suspension |
| LA/SL/3558(b) | South Lanarkshire | Confidentiality | Breach | 30/08/2023 | Breach | Censure |
Reports referred and hearing held in 2023/24 | ||||||
| LA/D/37421 | Dundee City | Disrespect towards employees/public | Breach | 06/06/2023 | Breach | Censure |
| LA/Fi/3614, 3587, 3606 and 3622 | Fife | Disrespect towards employees/public | No breach | 11/07/2023 | Breach | Censure |
| LA/Mi/3803 | Midlothian | Disrespect towards other Councillors | Breach | 23/08/2023 | No breach | Not found in breach |
| LA/NL/3705 | North Lanarkshire | Confidentiality | No breach | 29/09/2023 | Breach | Censure |
| LA/E/3645 | City of Edinburgh | Disrespect towards employees/public | Breach | 09/10/2023 | No breach | Not found in breach |
| LA/AS/3780 | Aberdeenshire | Disrespect towards employees/public | Breach | 30/10/2023 | Breach | Censure |
| LA/WL/3790 | West Lothian | Disrespect towards employees/public | No breach | 30/11/2023 | No breach | Not found in breach |
| LA/AC/3812 | Aberdeen City | Disrespect towards other Councillors | No breach | 17/01/2024 | No breach | Not found in breach |
| LA/NA/3707 | North Ayrshire | Quasi-Judicial or Regulatory Applications | Breach | 26/01/2024 | No breach | Not found in breach |
| LA/H/3759 | Highland | Disrespect towards employees/public & Registration of Interests | Breach | 06/02/2024 | Breach | Suspension |
| LA/WL/3698 | West Lothian | Disrespect towards other Councillors | No breach | 16/02/2024 | No breach | Not found in breach |
Reports referred in 2023/24 and hearing held in 2024/25; | ||||||
| LA/H/3838 | Highland | Disrespect towards other Councillors | No breach | 02/04/2024 | No Breach | Not found in breach |
| LA/I/3764 | Inverclyde | Quasi-Judicial or Regulatory Applications | Breach | 10/04/2024 | Breach | Suspension |
| LA/SB/3722 | Scottish Borders | Declaration of Interest | Breach | 13/05/2024 | Breach | Suspension |
| NPA/C/3831 | Cairngorms National Park Authority | Disrespect towards other employees/public & Declaration of Interest | Breach | 27/05/2024 | Breach | Censure |
| LA/As/3958 | Aberdeenshire | Confidentiality & Use of Council Resources | Breach | 05/06/2024 | Breach | Suspension |
1These cases were reported to SCS in different financial years but were combined into one Hearing due to the similar nature of the complaints.
Complaints about conduct
Performance analysis
Overview
This section of the report provides a summary of our performance as well as outlining any significant activities undertaken during the year. It also describes the organisation’s purpose and the key risks affecting it.