Our performance
Our progress against the first year of the 2024-2028 strategic plan is set out in Figure 3.
Stage 1 (Councillor and member cases)
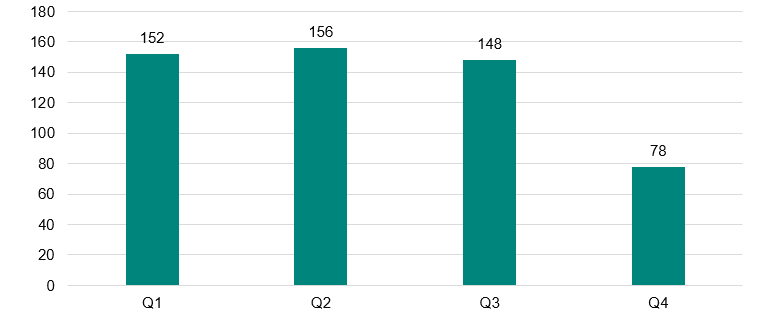
Performance at Stage 1 has shown marked improvement over the course of the year. While the average stood at 152 days across quarters 1-3, performance improved sharply in quarter 4, with cases completed in an average of 78 days – nearly a 50% reduction compared to earlier in the year.
The marked improvement in quarter 4 reflects the sustained efforts and initiatives introduced earlier in the year to enhance the efficiency and effectiveness of our complaints management alongside the additional time devoted by existing senior staff within the team during the final quarter of 2024/25. Their combined impact has become increasingly evidenced as the year has progressed, and we have continued to maintain this positive trend into the new financial year.
Exhibit 16 - Average number days spent at Stage 1 for cases completed by quarter in 2024/25| | Q1 | Q2 | Q3 | Q4 |
|---|
| Average number of days a complaint stays at stage 1 | 152 | 156 | 148 | 78 |
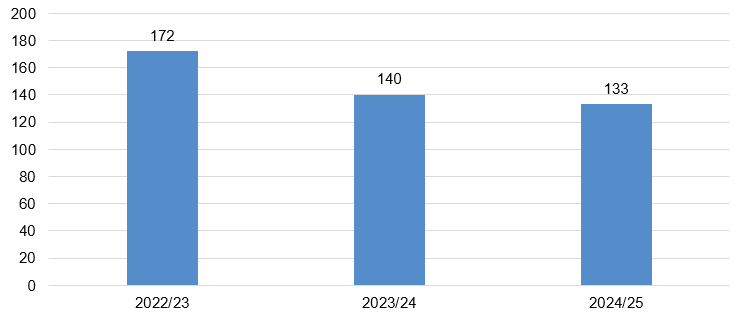
Exhibit 17- Average number days spent at Stage 1 for cases completed in 2024/25 and previous 2 reporting years | | 2022/23 | 2023/24 | 2024/25 |
|---|
Average number of days a complaint
stays at stage 1 | 172 | 140 | 133 |
Stage 2 (Councillor and Member cases)
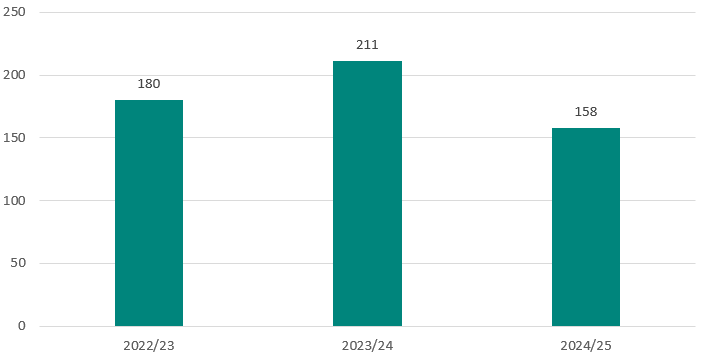
This year has seen a marked improvement in Stage 2 complaint handling. The average number of days to complete a Stage 2 case dropped from 211 days in 2023/24 to 158 days in 2024/25 – representing a significant 17% reduction.
While challenges remain in managing the complexity of Stage 2 investigations, we are committed to continuing with this progress. In 2025/26, we will build on this foundation by exploring further ways to reduce the time cases take to be investigated. A key focus will be on ensuring investigations are not only thorough but also proportionate – helping us to operate more efficiently and effectively.
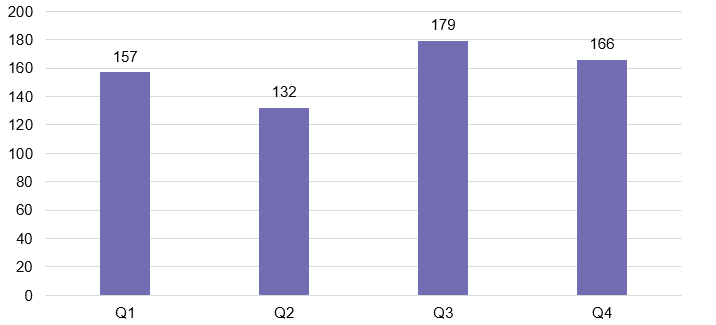
Exhibit 18 - Average number days spent at Stage 2 for cases completed by quarter in 2024/25| | Q1 | Q2 | Q3 | Q4 |
|---|
| Average number of days a complaint stays at stage 2 | 157 | 132 | 179 | 166 |
Exhibit 19 - Average number days spent at Stage 2 for cases completed in 2024/25 and previous 2 reporting years| | 2022/23 | 2023/24 | 2024/25 |
|---|
Average number of days a complaint
stays at stage 2 | 180 | 211 | 158 |